Obtaining hundreds of thousands of processing depth big data from just one laser processing hole
Laser processing has attracted much attention in recent years as a new manufacturing and processing technology that can be applied to materials that are difficult to process, such as carbon fiber composite materials and glass. In order to promote the industrial application of laser processing as a technology that can be designed and controlled, it is essential to understand the complex physical and chemical phenomena occurring during laser processing and to elucidate its principles. Recent research has also revealed that a combination of machine learning and large-scale first-principles calculations, which have made remarkable progress in recent years, can be a powerful method for achieving this goal. This requires the collection of a large amount of data on the depth and shape of the fabricated hole for various conditions of the laser beam, such as intensity, wavelength, and pulse width. However, since laser processing is an irreversible phenomenon, the experiments require the fabrication of many laser holes and their measurements. This limits the number of experiments that can be conducted and makes it difficult to obtain a large amount of systematic learning data.
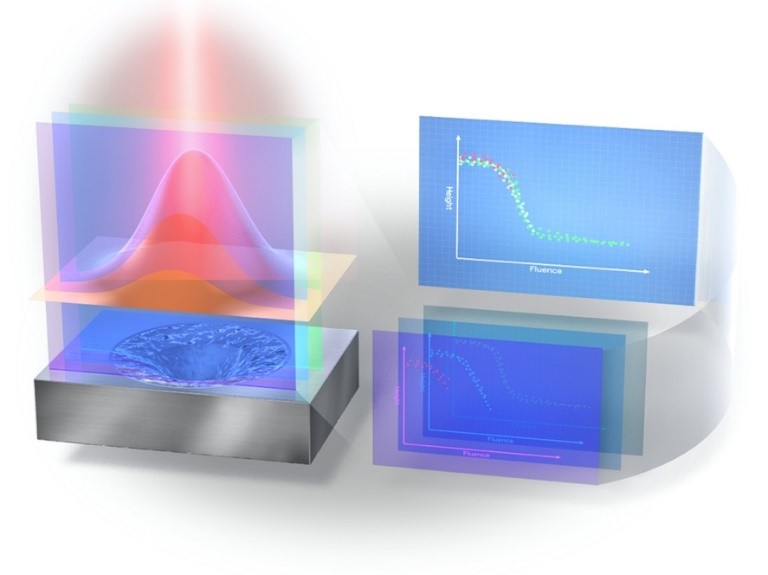
In this research, we have developed a new method (“fluence mapping”) that can obtain hundreds of thousands of data points from only one laser processing hole at a time by using imaging technology (Fig. 1). By focusing on the fact that the intensity distribution of laser pulses is spatially non-uniform, we succeeded in visualizing the relationship between the intensity of laser light and the processing depth for each location by strictly superimposing the intensity distribution of laser light measured with a homemade beam profiler and the depth distribution of the processed hole measured with a laser microscope (Fig. 2). We have succeeded in visualizing the relationship between laser beam intensity and processing depth for each location (Fig. 2). By doing so, we were able to obtain hundreds of thousands of data points from a single hole at once (Fig. 3), whereas previous methods could only obtain a limited amount of information such as hole depth and hole radius from a single hole. This method dramatically improves the efficiency of data acquisition required for machine learning and enables the systematic acquisition of reliable data for comparison with first-principles results.
Figure 1: Conceptual diagram of the invented fluence mapping method
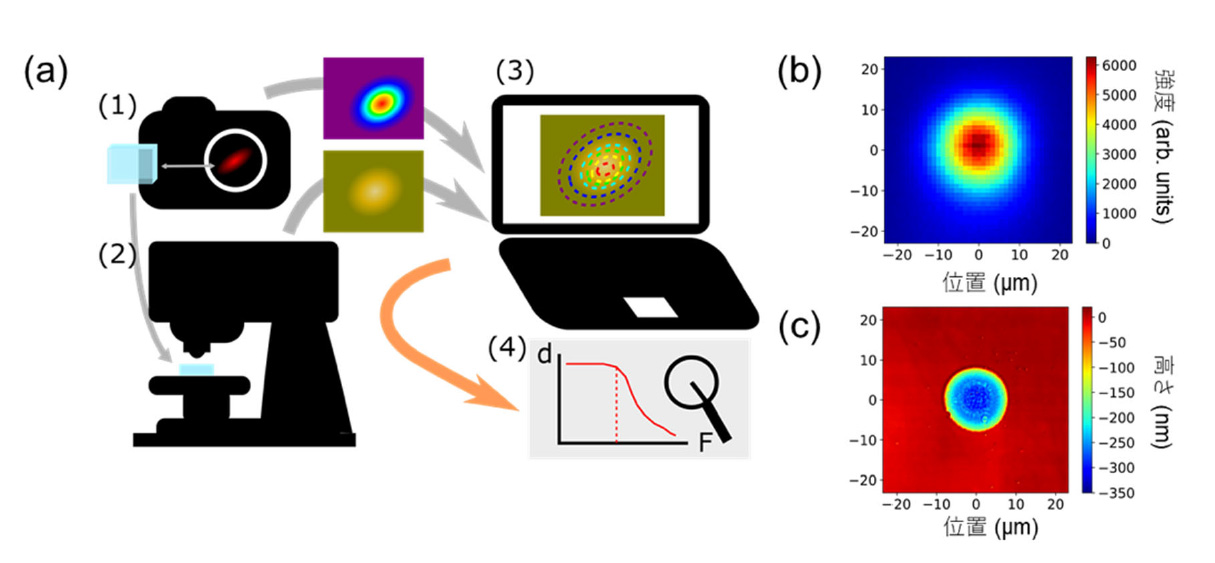
Figure 2: (a) Overview of the fluence mapping method. The measured local fluence distribution by a self-made beam profiler (1) and the measured hole depth by a laser microscope (2) are superimposed by numerical processing (3) and output as a histogram called “fluence map” (4). (b) Measured beam profile at the focal point of the laser pulse used for processing. (c) Measured height profile of a sapphire hole machined with a single laser pulse of 1030 nm wavelength and 190 fs pulse width.
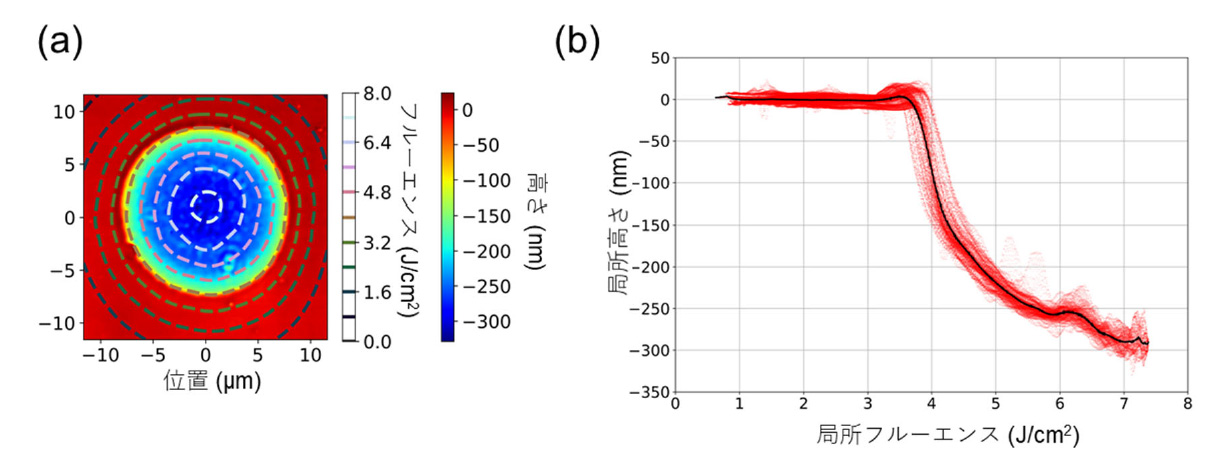
Figure 3: (a) Superimposed information of the local fluence of the laser beam and the fabricated hole height profile. (b) Histogram (“fluence map”) showing the relationship between local fluence and local height.
Published paper:
Haruyuki Sakurai, Kuniaki Konishi, Hiroharu Tamaru, Junji Yumoto, Makoto Kuwata-Gonokami
" Direct correlation of local fluence to single-pulse ultrashort laser ablated morphology ", Communications Materials, 2: 38 (2021).